
DeepSeek is the most important company in the world.
Not the most valuable. Not necessarily the company with the best model, or the one that will make the most money. I mean important in the sense that its existence could change how intelligence is built, priced, and controlled everywhere.
There are three reasons.
1. China cannot afford to lose
My bet is that China will be the most important country in the world to the future of AI. Not because it has the best chips today. It doesn't. But because it can combine manufacturing, electricity, and a national interest in not depending on American technology.
Beijing has explicitly made self-reliance in AI a national priority. That doesn't make DeepSeek a state-owned enterprise or guarantee its survival. It does make its work important for reasons that go well beyond selling subscriptions. China can afford to lose a company. It cannot afford to lose the ability to build competitive AI.
The chip lead is real
Nvidia, ASML, and SK hynix are a formidable triumvirate. Nvidia's advantage includes its accelerators and the systems connecting them. ASML supplies the EUV lithography equipment used to manufacture leading-edge chips. SK hynix supplies high-bandwidth memory. These are different layers of the same problem, not three interchangeable chip companies.
Really, TSMC belongs in that sentence too. Its 2nm process entered volume production in the fourth quarter of 2025. Huawei and SMIC are not at parity with this ecosystem. And SK hynix isn't the only advanced memory supplier: Micron and Samsung also make HBM4. The competitive lead belongs to an ecosystem, not a neat list of three logos.
That lead is not a few patents waiting to expire. It's manufacturing know-how, yields, tools, packaging, software, and years of getting all of them to work together. Chipmaking has enormous physical costs too.
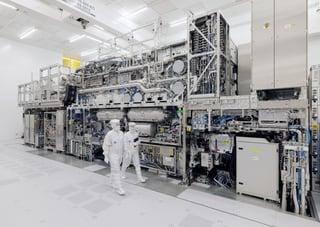

But that relative advantage will erode. That is the thesis, not a measured trend line or a claim that Huawei catches Nvidia by some particular date. The leaders will keep improving. The question is whether the gap narrows enough for a domestic alternative to be useful at scale.
Huawei's CloudMatrix384 paper describes one approach: connect 384 Ascend accelerators and pool resources across the system. That isn't proof of equal efficiency or equal economics. It is evidence that the competition isn't limited to making an identical, equally good chip.
You still have to build the power plant
Electricity is a different kind of constraint. There isn't one proprietary power grid everyone else is waiting for permission to use. You need actual generation, transformers, transmission lines, land, crews, and connections. Knowing how to build them doesn't mean they're already built.
Power technology has intellectual property too, and its costs aren't fixed forever. The distinction is the large upfront investment and the time it takes to put equipment in the ground. You can improve a turbine or a battery. You cannot download an energized substation.
A chip lead can narrow. You still have to build the power plant.
Consider the scale already operating in China. Ember records electricity demand of 10,573 terawatt-hours in 2025, up from 5,802 in 2015. That's an 82% increase in a decade. Demand isn't spare supply, but it shows the size of the electricity system already serving the economy.
01 / The scale of the system
China's electricity demand grew 82% in a decade
Annual electricity demand, terawatt-hours (TWh). Two observed years, not a forecast.
2015: 5,802 TWh. 2025: 10,573 TWh. Full data and source below.
View data and calculation
| Year | TWh |
|---|---|
| 2015 | 5,802 |
| 2025 | 10,573 |
Change: (10,573 / 5,802 − 1) × 100 = 82.23%, rounded to 82%. The chart uses these table rows directly.
And the buildout hasn't stopped. In 2025, China contributed 336 TWh of the world's 636 TWh increase in solar generation. More than half. That's actual additional annual output, not the nameplate capacity of projects announced in a press release.
02 / The pace of expansion
China supplied 53% of the rise in solar generation
Increase in annual solar electricity output from 2024 to 2025, TWh. Zero-based scale.
China: 336 TWh. United States: 85. EU: 60. Other countries: 155. Full data below.
View data and calculation
| Region | TWh added |
|---|---|
| China | 336 |
| United States | 85 |
| European Union | 60 |
| Other countries, calculated | 155 |
Other countries = 636 − 336 − 85 − 60 = 155 TWh. China's share = 336 / 636 = 52.83%, rounded to 53%. Published inputs are rounded.
One year's additions only tell part of the story. The longer record shows how far the buildout has come: China's solar output rose from 39 TWh in 2015 to almost 1,175 TWh in 2025. Wind kept growing alongside it.
03 / Annual history
China's wind and solar buildout has accelerated
Annual electricity generation in China, 2000 to 2025, TWh.
From 2000 to 2025, solar generation rose from 0.02 to 1,174.94 TWh; wind rose from 0.59 to 1,135.43 TWh.
View all annual data
| Year | Solar | Wind |
|---|---|---|
| 2000 | 0.02 | 0.59 |
| 2001 | 0.03 | 0.72 |
| 2002 | 0.05 | 0.84 |
| 2003 | 0.06 | 1.00 |
| 2004 | 0.08 | 1.28 |
| 2005 | 0.08 | 1.95 |
| 2006 | 0.09 | 3.71 |
| 2007 | 0.11 | 5.48 |
| 2008 | 0.15 | 13.10 |
| 2009 | 0.28 | 27.61 |
| 2010 | 0.70 | 49.40 |
| 2011 | 2.61 | 74.10 |
| 2012 | 3.59 | 103.05 |
| 2013 | 8.37 | 138.26 |
| 2014 | 23.51 | 159.76 |
| 2015 | 39.48 | 185.59 |
| 2016 | 66.53 | 240.86 |
| 2017 | 117.80 | 304.60 |
| 2018 | 176.90 | 365.80 |
| 2019 | 224.00 | 405.30 |
| 2020 | 261.10 | 466.50 |
| 2021 | 327.00 | 655.80 |
| 2022 | 427.27 | 762.67 |
| 2023 | 584.15 | 885.87 |
| 2024 | 839.04 | 997.04 |
| 2025 | 1,174.94 | 1,135.43 |
Every year is supplied by the source. Straight segments connect annual observations; no missing years are filled and no forecast is drawn. Solar and wind are separate sources, not cumulative series.
The mix is changing too. China is getting more of its electricity from renewables, but it isn't alone. The US and EU are doing the same. A higher renewable share is not the same as a larger grid, and none of these lines measures how much power is available for AI.
04 / Annual history
Renewables are taking a larger share of each grid
Renewable share of electricity generation, 2000 to 2025, %.
View all annual data
| Year | China | US | EU |
|---|---|---|---|
| 2000 | 16.64 | 9.23 | 15.51 |
| 2001 | 18.96 | 7.50 | 16.17 |
| 2002 | 17.61 | 8.75 | 14.32 |
| 2003 | 15.03 | 9.03 | 14.19 |
| 2004 | 16.22 | 8.73 | 15.35 |
| 2005 | 16.17 | 8.75 | 15.36 |
| 2006 | 15.59 | 9.43 | 15.94 |
| 2007 | 15.26 | 8.39 | 16.83 |
| 2008 | 19.02 | 9.18 | 18.27 |
| 2009 | 17.88 | 10.54 | 20.34 |
| 2010 | 18.69 | 10.31 | 22.16 |
| 2011 | 16.82 | 12.46 | 22.21 |
| 2012 | 20.04 | 12.19 | 25.11 |
| 2013 | 20.13 | 12.83 | 27.97 |
| 2014 | 22.26 | 13.35 | 29.64 |
| 2015 | 23.97 | 13.63 | 29.82 |
| 2016 | 24.82 | 15.29 | 30.14 |
| 2017 | 25.24 | 17.46 | 29.92 |
| 2018 | 25.61 | 17.44 | 32.36 |
| 2019 | 26.85 | 18.30 | 34.05 |
| 2020 | 28.09 | 20.31 | 38.50 |
| 2021 | 28.69 | 20.75 | 37.45 |
| 2022 | 30.18 | 22.34 | 38.88 |
| 2023 | 30.61 | 22.68 | 45.24 |
| 2024 | 33.70 | 24.07 | 48.02 |
| 2025 | 36.98 | 25.63 | 47.89 |
US means United States; EU means European Union. The same dated source table is used for all three series. Percentages are published to two decimals; 2025 includes Ember estimates. A higher share does not necessarily mean more electricity in TWh.
None of this means electricity is unlimited, uniformly cheap, or available at every site. A national total doesn't tell you whether a particular data center can connect. That's exactly why the physical buildout matters.
Equipment costs can fall dramatically. The historical solar-module price series fell about 96% between 2000 and 2024. That is exactly why "power costs are fixed" is the wrong claim. The harder constraint is turning cheaper equipment into a working system, on a specific site, in time.
05 / Annual history
Cheaper equipment is not the same as a connected grid
Solar module price, 2000 to 2024, constant 2024 US dollars per watt.
The historical module-price series fell from $6.29 per watt in 2000 to $0.26 in 2024, about 96%. This is not an electricity tariff.
View all annual data
| Year | Module |
|---|---|
| 2000 | 6.29 |
| 2001 | 6.09 |
| 2002 | 5.57 |
| 2003 | 5.29 |
| 2004 | 4.56 |
| 2005 | 4.60 |
| 2006 | 5.02 |
| 2007 | 5.06 |
| 2008 | 4.61 |
| 2009 | 3.08 |
| 2010 | 2.44 |
| 2011 | 2.00 |
| 2012 | 1.08 |
| 2013 | 0.83 |
| 2014 | 0.77 |
| 2015 | 0.72 |
| 2016 | 0.66 |
| 2017 | 0.56 |
| 2018 | 0.50 |
| 2019 | 0.45 |
| 2020 | 0.36 |
| 2021 | 0.32 |
| 2022 | 0.36 |
| 2023 | 0.31 |
| 2024 | 0.26 |
This is the frozen 2000 to 2024 series in 2024 dollars, not the subsequently revised live OWID series in 2025 dollars. The underlying benchmark changes over time and is not a single manufacturer's price. From 2010 it uses module benchmarks sold in Europe. No 2025 price is inferred. Decline: (1 − 0.26 / 6.29) × 100 = 95.87%.
The IEA's 2025 grid report found procurement times of two to three years for cables, up to four years for large power transformers, and more than five years for some direct-current cables. These are equipment waits, not even complete project timelines.
06 / The physical constraint
The equipment alone can take years to arrive
Procurement lead times reported by the IEA in 2025. A range and two bounds, not three averages.
Cables: 2 to 3 years. Large power transformers: up to 4 years. Some DC cables: more than 5 years.
View reported ranges and limits
| Equipment | Reported wait |
|---|---|
| Cables | 2 to 3 years |
| Large power transformers | Up to 4 years; no minimum specified |
| Some direct-current cables | More than 5 years; no maximum specified |
These are survey observations published in 2025, not live quotes or country-specific averages. The open-ended wait is not capped at five years.
Efficiency still matters
I'm not arguing that an inefficient chip is just as good because China has more electricity. More chips mean more memory, networking, cooling, and money. Power can't substitute for a component you cannot manufacture. And a more efficient chip lets you do more with the same electrical connection.
My argument is about which constraint gets easier first. If the chip and software gap narrows, the country that has already built the generation and grid has something very hard to reproduce quickly. The bet is not that Nvidia's efficiency stops mattering. It's that a narrowing efficiency gap makes China's physical advantages matter more.
2. It is counterpositioned to OpenAI and Anthropic
OpenAI and Anthropic are the second and third most important companies in the world. That makes DeepSeek's position against them even more interesting.
The premium, proprietary model business depends, at least in part, on customers paying for access to intelligence they cannot run themselves. A competitive model they can run themselves is a structural problem for that business.
With open-weight releases like V4, developers can download models and run them on their own infrastructure, subject to the published license. Open weights don't mean every piece of training data or code is public. But they do mean the model isn't confined to one company's API.
DeepSeek doesn't need to be the best model every Tuesday. It only needs to keep getting close enough. If a model you can run yourself is almost as good as the one you're renting, that changes what you're willing to pay.
OpenAI and Anthropic can keep advancing the frontier. DeepSeek can keep pulling a large part of that frontier toward a commodity. It doesn't have to win the premium customer to make the premium harder to justify. That doesn't erase the value of reliability, service, or a genuinely better product. It does change the alternative customers can compare it against.
3. Intelligence is becoming a question of sovereignty
Most countries will never build a frontier AI lab. Neither will most companies. But that doesn't mean they'll want their most important technology to depend entirely on an American provider.
An open-weight model can be hosted locally and adapted for local use. A bank can keep data on its own servers. A government can build services without renting every inference from a foreign company. This is more than a pricing advantage. It's a different answer to who controls the infrastructure.
There is already evidence of demand outside the usual markets. Microsoft's research on AI adoption in 2025 describes DeepSeek's traction in China, Russia, Iran, Cuba, Belarus, and parts of Africa. That's evidence of adoption, not proof that those users have achieved technological independence.
DeepSeek isn't automatically neutral or safe. Open weights don't erase biases or security risks, and other open models compete for the same role. The desire to control AI infrastructure is real, and much bigger than one chatbot.
The next billion AI users may not care which company tops the latest benchmark. Their governments and employers may care a lot about whose infrastructure they can actually control.
The important part
DeepSeek doesn't have to win every benchmark or become the world's biggest consumer app. China has an extraordinary incentive to keep domestic AI competitive. Open models give customers an alternative to closed labs. And a narrowing chip gap could make the electricity and manufacturing capacity China has already built much more consequential.
Maybe another Chinese lab or another open model surpasses it. That would weaken the case for DeepSeek specifically, even if it strengthened the broader argument. A national priority is not a guarantee for one company.
The company that captures the most value from AI and the company that most changes the economics and politics of AI don't have to be the same company. That is what makes DeepSeek the most important company in the world.
Updated November 11, 2026. The figures use dated, published observations, not projections of future chip performance. Charts are rendered from the source tables in code. Historical series use the dated data versions identified in each caption, not live feeds.